A Founder's Guide to Calculating Churn Rate for Mobile Apps
Learn how to master calculating churn rate with essential formulas and methods. Reduce user loss and drive scalable growth with this founder's guide.
Ignoring churn is like trying to fill a bucket with a hole in it. You can keep pouring in resources, but you'll never get ahead if your existing users are constantly slipping away. Calculating churn isn't just some task to hand off to your data team; for a founder, it's one of the most vital signs of your app's health. It tells you exactly how fast users are giving up on your app over a specific period.
Why Churn Rate Is a Founder's Most Critical Growth Metric
You’re spending thousands, maybe even millions, on user acquisition for mobile apps. You're running campaigns on TikTok, fine-tuning your Instagram ads, and doing everything you can to get those downloads. But what happens after the install?
If new users are leaving just as quickly as they arrive, all that ad spend is essentially going down the drain. A high churn rate directly eats away at the ROI of every single marketing dollar you spend.
This is precisely why getting a handle on your churn rate is so fundamental. It’s the very first step toward building a mobile app that's not just growing, but is also sustainable and profitable. Once you understand why and when people leave, you can finally start to plug the leaks in your product and user experience. It's not just about saving money. It's about building a solid foundation you can actually scale on.

Connecting Churn to Your Bottom Line
Every user who walks away is more than just a number; they represent lost revenue and a missed opportunity for future value. A high churn rate is a flashing red light, signaling deeper issues that can hit your business where it hurts.
Here’s how it breaks down:
- Profitability: It costs so much more to acquire a new customer than to keep one you already have. Even small improvements in churn can directly boost your profit margins.
- Scalability: You simply can't scale a business that’s losing customers faster than it’s gaining them. Real growth requires predictable retention.
- Valuation: Investors scrutinize churn rates. A low, stable churn shows them you have strong product-market fit and a healthy, predictable business, which makes your app far more valuable in their eyes.
Churn is more than just a metric; it's a direct reflection of the value your app delivers. If your churn rate is high, it's a clear sign that users aren't getting what they expected or what they truly need from your product.
The Impact on Your Acquisition Strategy
When you truly understand your churn, it completely changes how you approach growth. Instead of focusing only on top-of-funnel metrics like downloads, you start to see the bigger picture: the entire user lifecycle.
For instance, you might have a campaign that drives thousands of downloads, which looks great on a report. But if you dig into the data and see that 90% of those users churn within the first week, you realize the campaign was actually a failure.
By analyzing churn data, you can refine your ad targeting, sharpen your messaging, and adjust your creatives to attract users who are much more likely to stick around. This is how you turn your growth engine from a leaky bucket into a compounding asset. This guide will give you a clear roadmap for turning that churn data into your most powerful tool for growth.
The Fundamental Churn Formulas Every Founder Must Know
To get a real handle on your app's health, you have to move past gut feelings and start looking at the hard numbers. The good news is that calculating churn isn't some dark art reserved for data scientists. It all starts with a couple of straightforward formulas that every app founder should know by heart.
Think of these formulas as your core diagnostic tools. They measure the flow of people and money moving through your business, giving you the objective data needed to make smarter calls on your product, marketing, and growth strategy.
The Standard User Churn Formula
The first place everyone starts is with user churn rate. This number tells you what percentage of your users bailed on your app over a set period. It's the bedrock metric for understanding just how "sticky" your product really is.
For founders using platforms like Adworkly to run campaigns on TikTok or Meta, this number is critical. It shows you how many of those hard-won users are actually sticking around. The standard formula, used by industry leaders like Sendbird and UXCam, is refreshingly simple:
Churn Rate = ((Users at Start - Users at End) / Users at Start) × 100%
To see this in action, let's imagine your fitness app kicked off June with 10,000 active users. By the end of the month, you check again and find that only 8,500 of that initial group are still using the app.
- Users at Start: 10,000
- Users at End (from the original group): 8,500
- Churned Users: 10,000 - 8,500 = 1,500
Plugging those numbers into the formula gives you: (1,500 / 10,000) x 100 = a 15% user churn rate for June. That single number tells a huge story about your app's ability to hold onto its audience. For more on this, Ethora.com offers great insights on retention by industry.
Why Revenue Churn Is Just as Important
While user churn is a must-track metric, it doesn't paint the full picture, especially if you run a subscription app. Let's be honest: not all users are created equal. Losing a free user is a bummer, but losing a top-tier annual subscriber is a financial body blow.
This is where revenue churn, also known as MRR (Monthly Recurring Revenue) Churn, enters the scene. This metric tracks the percentage of revenue you've lost from your existing customers in a given period. It gives you a much clearer, and often more sobering, look at your business's financial stability.
Revenue churn often provides a more painful, but more accurate, picture of your business's stability. A low user churn rate can easily hide a high revenue churn rate if the few customers you lose are your biggest spenders.
Think about that fitness app again. You might be celebrating a low user churn of just 5%. But what if all those departing users were your power users on the $29.99/month premium plan? The hit to your bank account would be massive. On the flip side, you could have a 20% user churn rate, but if they were all free-trial users who never converted, your bottom line would be completely unscathed.
User Churn vs Revenue Churn Explained
Getting a firm grasp on the difference between these two metrics is absolutely crucial for making smart decisions. One tells you about engagement and product-market fit; the other tells you if you have a viable business.
Here's a simple breakdown to help you keep them straight.
By tracking both, you get the complete story. You'll know not just how many users are leaving, but also the real financial cost of their departure. This dual perspective is the key to building a truly sustainable growth engine for your mobile app.
Choosing Your Analysis Method: Cohort vs. Rolling
Alright, you've got the basic churn formulas down. Now comes the interesting part: deciding how to look at your data. The method you pick can completely change the story your numbers tell. Think of it like a camera lens. One gives you a wide, panoramic view, while the other lets you zoom in on the fine details.
For churn, the two most common lenses are cohort analysis and rolling calculations. Each serves a different purpose, and knowing when to use which is the secret to pulling out insights you can actually act on. One tells you the long-term story of your users, while the other gives you an immediate health check.

Cohort Analysis: The Gold Standard for Understanding Behavior
There's a reason everyone in product and growth considers cohort analysis the gold standard. It gives you the deepest, most nuanced picture of user behavior by grouping users based on when they joined your app.
Instead of lumping your entire user base into one giant, messy pile, you segment them into clean groups. You might create a "January Week 1" cohort, a "January Week 2" cohort, and so on. From there, you track each group’s journey separately.
This approach is incredibly powerful. Here’s why:
- It isolates variables. Want to know if that new onboarding flow you launched in February actually worked? You can compare the retention of the "February" cohort against the "January" cohort. Cohort analysis gives you a clean answer.
- It reveals long-term trends. You can see if users who sign up today are sticking around longer than those who signed up a year ago. It's a fantastic indicator of improving product-market fit.
- It pinpoints at-risk moments. By watching cohorts, you can spot exactly when people tend to bail. Maybe you see a huge drop-off around Day 14 for every single cohort. That’s a clear signal to dig into what's happening at the two-week mark.
A cohort analysis doesn't just tell you that you have a churn problem. It helps you understand the why and when by tying user behavior directly to your product's evolution.
The Rolling Calculation: A Real-Time Health Check
While cohort analysis is deep, it can be slow and complex. You have to wait for time to pass to see the long-term effects. That's where the rolling calculation comes in. It’s a much simpler, more immediate snapshot of your app’s health over a fixed period, like the last 30 or 90 days.
This is what most people first think of when they talk about calculating churn. You’re not segmenting users by sign-up date; you're just looking at your entire active user base within that specific window of time.
It’s your go-to metric for a quick pulse check. It answers the question, "What was our overall churn rate last month?" without the heavy lifting of tracking individual groups across their entire lifecycle.
When to Use Each Method
The key isn't to pick one over the other. It's about using them together to get the full story. They’re different tools for different jobs.
Ultimately, cohort analysis provides the strategic, long-term insights you need to make fundamental improvements to your product. A rolling calculation, on the other hand, gives you the tactical, day-to-day data you need to spot sudden problems and keep your finger on the pulse.
Putting Churn Calculation into Practice with Spreadsheets and SQL
Enough with the theory. Let's get our hands dirty and actually calculate your churn rate using tools you already have. You don't need a fancy analytics suite to get started.
We'll begin with the most straightforward approach: a simple spreadsheet. Whether you're a fan of Google Sheets or Microsoft Excel, this manual method is fantastic for really understanding the moving parts of the churn formula.
From there, we’ll move on to a more automated and scalable solution using SQL. As your app grows, you won't want to be plugging numbers into a spreadsheet every month. A quick query is way more efficient and less prone to human error.
Calculating Churn in a Spreadsheet
Let's imagine you run a nutrition-tracking app called "NutriPal." You want to figure out your user churn for April. To do this, you just need three pieces of data from your user database.
Here’s the data for NutriPal in April:
- Users at the Start of the Period (April 1): 20,000
- New Users Acquired During the Period: 5,000
- Users at the End of the Period (April 30): 23,500
First things first, we need to figure out how many users actually churned. The logic is simple: find out how many users you should have had, and then compare that to what you actually have.
Starting Users + New Users = Expected Users at End
20,000 + 5,000 = 25,000
So, based on our starting point and new signups, we should have ended April with 25,000 users. But the final count was only 23,500. That gap is our churn.
Expected Users - Actual Ending Users = Churned Users
25,000 - 23,500 = 1,500
Boom. We lost 1,500 users. Now we can plug that into the churn rate formula. A crucial point here: the churn rate is always calculated against the number of users you had at the beginning of the period.
(Churned Users / Starting Users) * 100 = Churn Rate
(1,500 / 20,000) * 100 = 7.5%
And there it is. NutriPal’s user churn rate for April was 7.5%. This is a solid, actionable metric you can now track month over month.
Automating Churn Calculation with SQL
For anyone with a technical background or a rapidly growing user base, the spreadsheet method quickly becomes a bottleneck. That's where SQL comes in to save the day.
Let’s assume your database has a users table with a few key columns: user_id, created_at (when they signed up), and last_seen_at (the timestamp of their last activity).
We can write a query to calculate churn for a specific month, like April 2024. The query's job is to find users who were active before April but then went completely silent during April.
-- This query calculates the monthly user churn rate for April 2024. -- First, we define our period of interest. WITH date_params AS ( SELECT '2024-04-01'::date AS period_start, '2024-04-30'::date AS period_end ), -- Next, we identify users who were active before the start of the period. active_users_at_start AS ( SELECT user_id FROM users WHERE last_seen_at < (SELECT period_start FROM date_params) ), -- Then, we identify which of those users churned (were not seen during the period). churned_users AS ( SELECT user_id FROM active_users_at_start WHERE user_id NOT IN ( SELECT user_id FROM users WHERE last_seen_at BETWEEN (SELECT period_start FROM date_params) AND (SELECT period_end FROM date_params) ) ) -- Finally, we perform the calculation. SELECT ( CAST( (SELECT COUNT() FROM churned_users) AS NUMERIC ) / CAST( (SELECT COUNT() FROM active_users_at_start) AS NUMERIC ) ) * 100 AS churn_rate_percentage;
A Quick Tip on SQL Logic: How you define an "active" user is everything. In this example, we're using last_seen_at as a proxy for activity. But maybe for your app, "active" means completing a specific action or opening a certain screen. If so, you'll need to tweak the query to reflect your own business logic.
This SQL query automates the entire counting process. It identifies your starting user base, figures out which of them vanished during the month, and spits out a precise churn rate. You can set it up to run on demand or as part of a recurring dashboard report.
What's a Good Churn Rate for a Mobile App? (Industry Benchmarks)
So you've calculated your churn rate. The next question is always, "Is this number any good?"
The honest answer? It depends. There's no magic number that works for everyone. Comparing your fitness app's churn to a B2B project management tool is like comparing apples and oranges. Their users, goals, and engagement cycles are worlds apart.
Your real objective isn't to hit some universal benchmark but to figure out where you stand in your own competitive arena and, most importantly, to improve your own numbers over time.
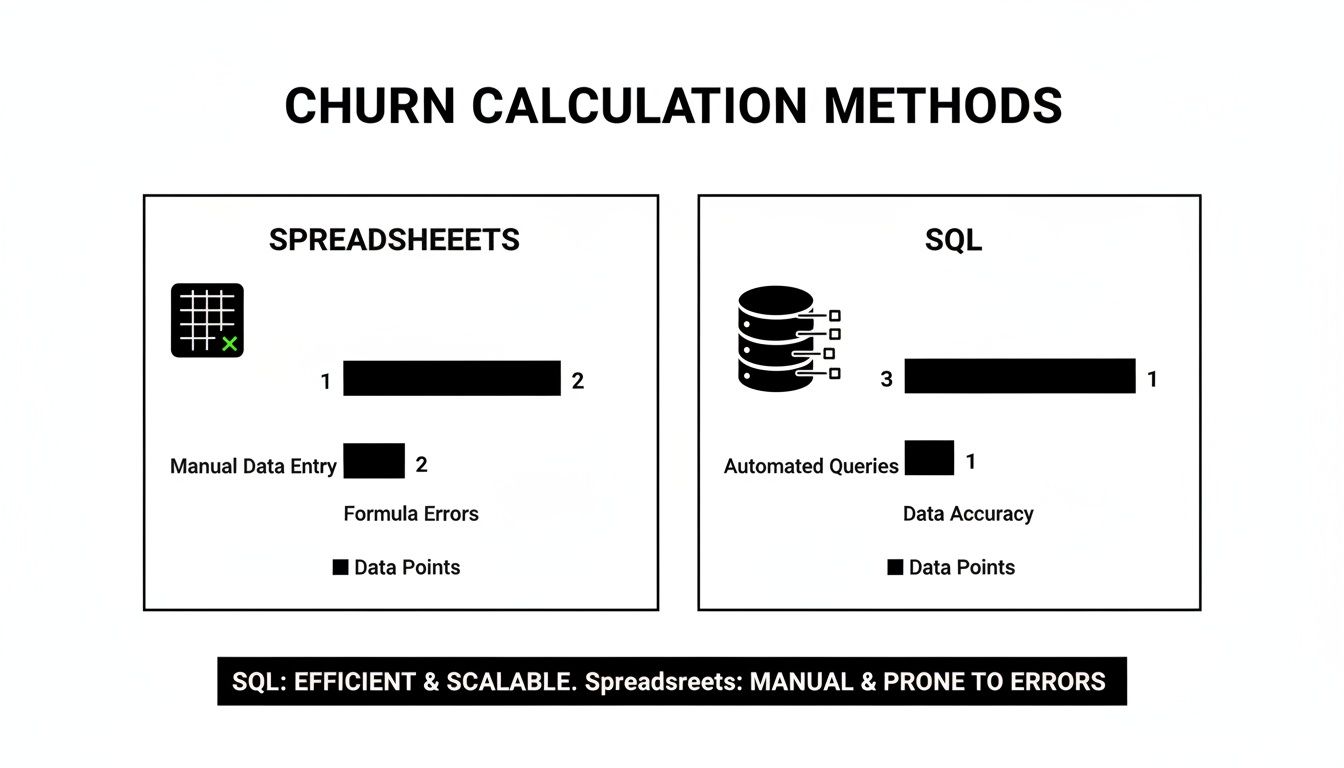
This visual breaks down two common ways to tackle churn calculations: spreadsheets and SQL. Spreadsheets are fantastic for getting your hands dirty and really understanding the mechanics, but SQL is where you get scalable, automated analysis for the long haul.
The Harsh Reality of Early Churn
Let's get straight to it: the mobile app world is brutal, especially right after an install. A global study puts the average Day 1 retention rate at just 26.1%.
Flip that number, and you get a staggering Day 1 churn rate of 73.9%. Think about that. More than seven out of every ten new users are gone within 24 hours. This trend continues, painting a sobering picture of the first month:
- By Day 7: It’s completely normal for 85-90% of your initial user base to have churned.
- By Day 30: Don't be surprised if your churn rate climbs past 95%.
These stats aren't meant to be discouraging; they're your reality check. The goal isn't to hit zero churn on day one. The real win is beating the average by even a few percentage points. That’s where sustainable growth comes from.
Paid vs. Organic: Not All Users Churn the Same
Where a user comes from tells you a lot about how likely they are to stick around. You can't treat all acquisition sources as equal.
- Paid Users: Someone who clicked a TikTok or Meta ad might churn faster. Why? The ad might have set an expectation that the app didn't immediately meet. They have little skin in the game, so they're quick to leave if they don't find value right away.
- Organic Users: These are the people who found you through an App Store search or a friend's recommendation. They came looking for a solution, which means their initial intent is much stronger. This almost always translates to lower early churn.
This is exactly why you need to segment your churn analysis by acquisition channel. If you see that users from your paid campaigns are churning out at a much higher rate, it’s a red flag. It probably means there’s a mismatch between your ad creative and the actual in-app experience.
Fixing that alignment won’t just improve retention; it will also bring down your overall acquisition costs. To see how closely these two metrics are tied, check out our customer acquisition cost calculator.
Ultimately, a "good" churn rate is a rate that's getting better every month. Once you start benchmarking against your specific industry and segmenting your users, the question changes from "Is my rate good?" to "What are we doing to improve it next quarter?"
Actionable Strategies to Reduce Your Churn Rate Now
You've done the hard work of calculating your churn rate. Now what? The real value of that number isn't just knowing it; it's using it to make smart decisions that keep users around. Reducing churn isn't a one-and-done task. It's a continuous effort that weaves through every part of your app's journey, starting well before the first tap.
The battle against churn actually begins with your acquisition strategy. If you're attracting the wrong audience, you're setting yourself up for high churn before they even finish onboarding.

Target the Right Users from Day One
Think of your app as a bucket. It's much harder to patch leaks if you're constantly pouring in the wrong kind of water. The same is true for users. When your marketing promises an experience your app doesn't deliver, new users will bounce, and they won't look back.
Here’s how to tighten up your acquisition funnel to attract people who will actually stick around:
- Nail Your App Store Presence. Your app store page is your digital storefront. Make sure your screenshots, description, and keywords are an honest reflection of your app's core value. Stay away from misleading language that attracts quick downloads from people who aren't your ideal users.
- Get Granular with Ad Campaigns. Dig deep into your paid acquisition performance. Stop looking just at cost-per-install (CPI) and start analyzing the churn rate of users from each specific ad creative and channel. A campaign with a low CPI but a massive churn rate is just burning cash. Double down on the channels that bring in loyal users, even if they cost a bit more upfront.
Strengthen Retention with In-App Strategies
Once you get the right users through the door, the next challenge is to deliver an experience that makes them want to stay. This is where your in-app engagement and retention tactics are make-or-break.
A smooth, intuitive onboarding process is table stakes. Your mission is to get new users to their "aha!" moment, that magical point where they truly get your app's value, as fast as possible. Don't throw every feature at them at once. Instead, guide them toward one key action that showcases what makes your app great. For a more detailed playbook, these mobile app retention strategies are packed with proven ideas.
Remember: Most churn happens within the first few days. Your strategy should be laser-focused on making those initial sessions count. A user who understands your app's value by Day 3 is exponentially more likely to become a long-term advocate.
To keep them engaged, communication is key. This doesn't mean spamming users with generic notifications. It's about sending the right message, to the right person, at the right time. For instance, if your churn analysis shows a big drop-off after Day 3, maybe that's the perfect time to send a helpful tip via a push notification. That simple nudge can be all it takes to bring a user back from the brink of churning.
Got Questions About Churn? Let's Talk Specifics
Even when you have the right formulas in hand, calculating churn can still throw you a few curveballs. Here are a couple of the most common questions I hear from app founders when they first start digging into their metrics.
What’s Actually a “Good” Churn Rate?
Honestly, there’s no magic number. A good churn rate for your app depends entirely on your industry, business model, and how long you've been around.
A B2C social media app, for instance, is going to have a wildly different churn profile than a B2B SaaS tool that’s embedded in a company’s workflow. Instead of chasing some universal benchmark you read about online, focus on establishing your own baseline. From there, your goal is to consistently nudge it downward, month after month.
Ultimately, a "good" churn rate is one that is steadily decreasing over time because you're actively making your product better.
Think of high churn as a symptom, not the disease itself. It’s a massive red flag that there’s a mismatch between the value users expect and what your app actually delivers. It could mean your ad campaigns are pulling in the wrong crowd, or maybe your onboarding flow just isn’t clicking fast enough to show off your app's "aha!" moment.
The real takeaway here is that a high churn rate is your users telling you something is wrong. It's a signal to dig deeper into your user experience, re-evaluate your product-market fit, and check if your marketing promises line up with reality.
Churn vs. Attrition: What’s the Difference?
You’ll often hear these two terms thrown around as if they mean the same thing, but the distinction is pretty important for your strategy.
Churn is an active choice. It's when a customer consciously decides to cancel their subscription or stop using your app, often because they've found a competitor they like better. This is the stuff you can directly influence through your product, pricing, and customer support.
Attrition, on the other hand, is more passive and often out of your hands. This is when a user disappears for external reasons. For example, the user of a project management app might stop using it because their company went out of business or they changed jobs.
While both scenarios mean you've lost a user, knowing the difference helps you focus your retention efforts where they can actually make an impact. There's no point in trying to win back a user who simply doesn't have a need for your app anymore.
Ready to stop guessing and start growing? Adworkly combines expert strategy with AI to build scalable acquisition and retention engines for mobile apps. Get in touch to see how we can lower your churn and build a loyal user base.