
Mastering TikTok Analytics for Growth
A complete guide to TikTok analytics. Learn to read key metrics, understand your followers, and build a content strategy that drives audience growth.
TikTok analytics is your personal feedback loop. It is the built-in tool that shows you how your videos perform with viewers and what your followers respond to. Instead of posting content and hoping something works, this data helps you make smart, informed decisions about what to create next.
Why TikTok Analytics Matter for Your Growth
Getting comfortable with your TikTok analytics is the single best thing you can do to build a presence on the platform. These are not numbers on a screen; they are direct messages from your audience. They tell you which videos made people stop scrolling, which ones got a laugh and a share, and which ideas did not connect. Without this insight, you are flying blind.
When you consistently check your analytics, you start to see patterns. You learn what works, so you can do more of it. This creates a positive feedback loop that builds momentum, pushing your content to a wider audience and attracting new followers who are into what you do.
Understand Your Audience on a Deeper Level
The data gives you a clear picture of who is watching your videos. As of early 2025, TikTok has 1.59 billion monthly active users, and a huge portion is young adults. The user base is dominated by 36.2% of users aged 18-24 and another 33.9% aged 25-34, making it the place to be if you want to reach those groups. You can always look into the latest global TikTok usage stats to see how your own audience compares.
This demographic information is pure gold. Knowing the age, gender, and location of your followers allows you to tailor your content to what they care about, referencing things that make sense in their world. When you get this right, you see much higher engagement and start to build a real community.
Your analytics dashboard is a roadmap. It shows you the path to creating content that reaches people and resonates with them, turning casual viewers into dedicated followers.
The official portal for all this data is TikTok for Business, which houses the analytics and advertising tools for creators and brands.
This is your command center for measuring performance and understanding the audience you connect with.
Drive Sustainable Account Growth
Leaning on your analytics means you can be strategic with your time and energy. Rather than creating content at random and hoping for a viral hit, you can focus your efforts on video formats and topics that you know have a history of success. This data-backed approach saves time and makes your creative work more effective.
By regularly checking your performance, you can:
- Spot your top-performing videos and figure out what made them work.
- Pinpoint the best times to post to get a crucial initial burst of views.
- Watch your follower growth and see which specific videos bring new people in.
TikTok analytics gives you the blueprint for a sustainable growth strategy. It equips you to make smarter decisions, adapt quickly to what your audience wants, and hit your goals on the platform.
How to Access Your TikTok Analytics Data
Before you can review any of your performance metrics, you first need to turn on the analytics feature. TikTok keeps its analytics locked for Business or Creator accounts, but switching from a personal account is easy and free. Making this quick change unlocks the data dashboard you will need to start making smarter content decisions.
Once you have the right account type set up, finding your data is simple. Let’s walk through how to get you to the suite of tools designed to help you understand your audience and how your content performs.
Enabling Analytics on Your Phone
Most of us run our TikTok accounts straight from our phones, so let’s start there. The process takes less than a minute.
- Head to your Profile page.
- Tap the three horizontal lines in the top right corner (the "hamburger" menu).
- Choose either Creator tools or Business suite, depending on which account you have.
- From there, tap on Analytics to open your dashboard.
A quick heads-up: after you flip the switch, TikTok needs a few days to start gathering data. You will not see anything right away, so give it about a week and then check back. This waiting period is normal; the system needs time to collect enough information to give you meaningful reports.
Switching to a Business or Creator account is your ticket in. It is the essential first step that signals to TikTok you are serious about creating, and in return, it gives you the tools to measure and sharpen your strategy.
Using the Desktop Dashboard
While the mobile app is perfect for on-the-go checks, the desktop version is where deep-dive analysis happens. When you log into your TikTok account on a computer, you get a much bigger, more comprehensive view of your analytics. It is easier to scrutinize graphs, compare different date ranges, and download your data for a closer look.
The desktop view shows you all the same metrics, but the layout makes everything easier to digest and manage. For anyone serious about building a data-informed strategy, getting comfortable with the fundamentals of TikTok marketing on the desktop dashboard gives you a huge advantage. It lets you see the full picture of your account’s health and growth.
Decoding Your Key Performance Metrics
Think of the Overview tab in your TikTok analytics as your account’s command center. It is not about drowning you in data; it is designed to give you a quick, at-a-glance summary of your performance. This is where you can instantly spot what hits the mark and what falls flat.
This dashboard gives you a clean snapshot of your account's health. You can toggle the date range to see what happened over the last 7, 28, or 60 days. This is useful for tracking short-term experiments (like a new video series) and long-term growth trends.
Understanding Core Engagement Metrics
Before you can make smart moves, you have to know what these numbers mean. They are not scores; they are clues telling you how people react to your content.
Here is a quick rundown of the main metrics you will see and what they tell you about your performance.
Key Metrics in the Overview Tab
These core metrics work together to paint a full picture of your account's performance, from basic visibility to community engagement.
The diagram below helps visualize how these different data points of views, engagement, and follower growth all fit together.
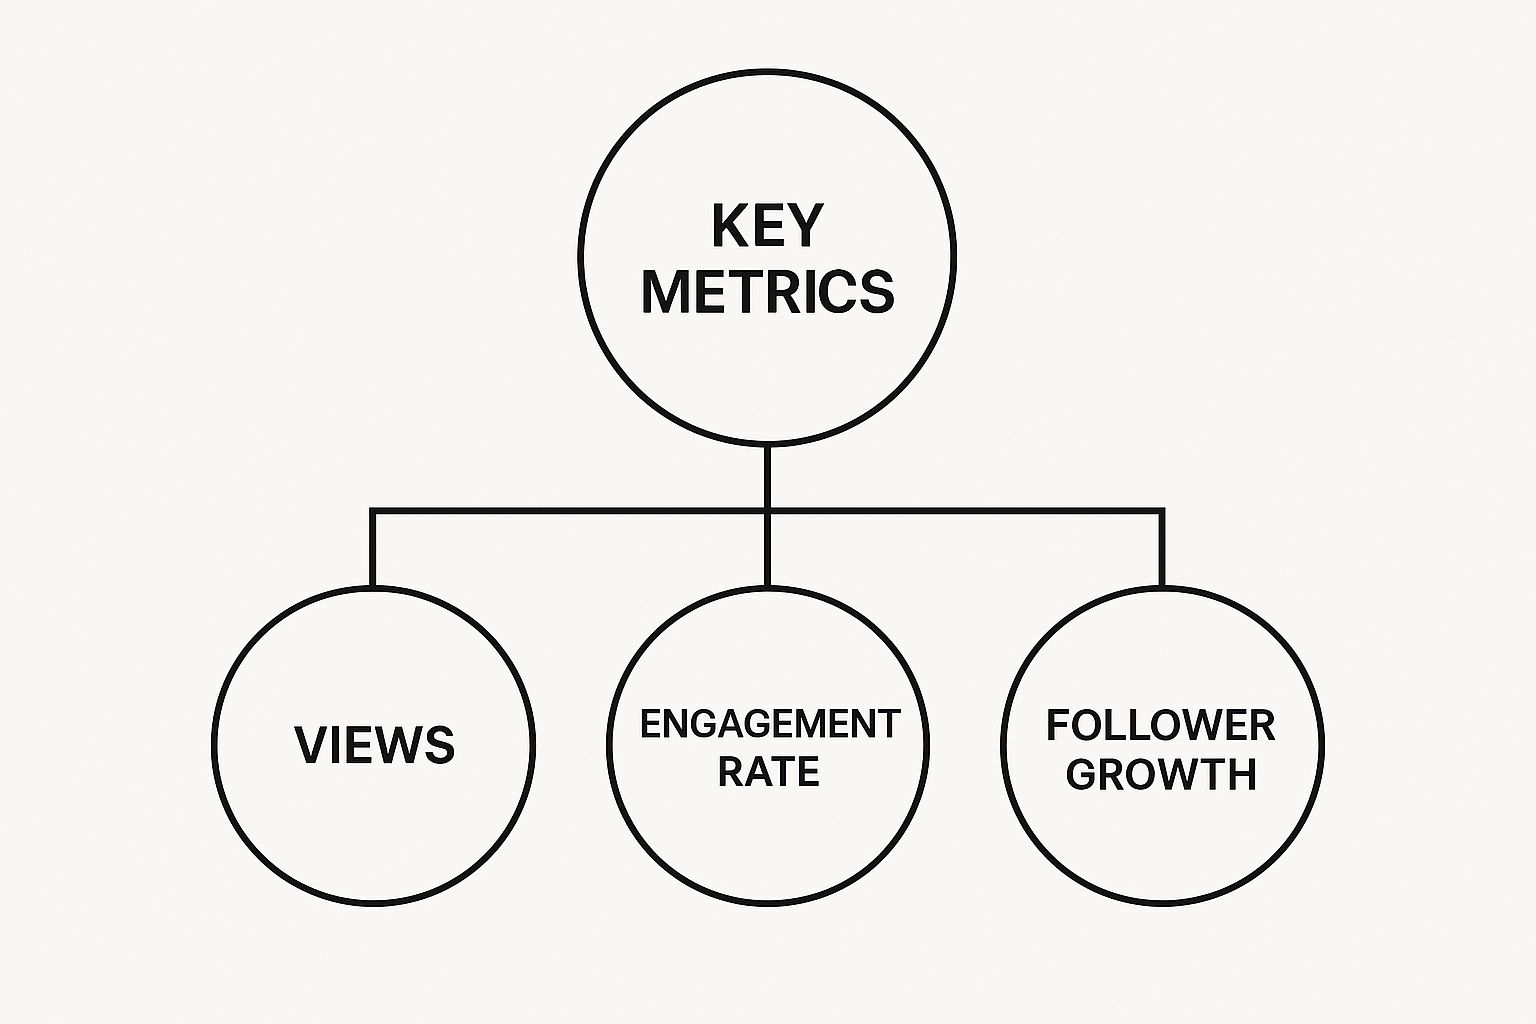
As you can see, it is not about one number; it is about how they all influence each other to drive overall growth.
Interpreting the Numbers for Your Strategy
Every metric tells a part of the story. A video with tons of likes but almost no comments might be visually stunning but did not make people think. A video with high shares and comments probably struck a chord with your audience.
The magic happens when you look at these numbers together. Did you see a huge spike in Profile Views right after posting that "day in the life" video? That is a massive clue that this style of content got people curious about who you are. That is a piece of actionable data you can immediately use to plan your next video.
Understanding this stuff is more important than ever, especially when you consider TikTok's staggering growth. The platform exploded from 55 million monthly active users in January 2018 to over 1 billion by September 2021. You can dig deeper into TikTok's user growth to grasp the sheer scale of the opportunity here. The audience is massive, but they will only stick around for creators who pay attention to what the data tells them.
Focus on the relationship between metrics, not individual numbers. A high share count is often more valuable than a high like count because it directly contributes to expanding your reach to new audiences.
Using Date Ranges to Spot Trends
That toggle for 7, 28, and 60 day views is more useful than it looks.
Use the 7-day view for immediate feedback. It is perfect for checking if a new video format you are testing is working or if a certain sound gets you more traction.
Switch to the 28 and 60-day views to zoom out and spot the bigger picture. Are your video views climbing month over month? Is your follower growth speeding up or starting to plateau? Answering these questions helps you judge the overall health of your strategy and make smart tweaks for long-term success.
By making a habit of checking your Overview tab, you will start to build a gut feeling for what your audience loves. This data-driven approach takes the guesswork out of content creation and puts you in control of your account’s growth.
Analyzing Individual Video Performance

Now, let's get into the good stuff. The Content tab is where you zoom in from the big picture to see how each of your videos is holding up. While the Overview tab gives you a summary, this is where you will find the nitty-gritty details that explain why some videos perform well while others do not.
You will see a list of every video you have posted in the last seven days, with the newest ones at the top. This setup lets you quickly spot what is working right now. Tap on any video, and you will open a dedicated dashboard for that specific post. This is where we move past vanity metrics like view counts and start digging into viewer behavior.
Unpacking Key Video Retention Metrics
If there is one thing the TikTok algorithm loves, it is retention. When people stick around to watch your videos, you send a signal to TikTok that your content is valuable and worth pushing to a wider audience. Three metrics are crucial for understanding your retention.
- Total Play Time: This is the grand total of all the minutes and seconds people have spent watching your video. Think of it as the video's overall lifespan in terms of attention.
- Average Watch Time: This is the gold standard. It tells you, on average, how long a single person watched your video. It is a direct measure of how captivating your content was from start to finish.
- Watched Full Video: This is the percentage of viewers who saw your video all the way to the end. A high number here is a fantastic sign that you created something compelling.
A high average watch time is a massive win, especially on a longer video. Let's say you posted a 60-second clip and the average watch time is 45 seconds. That is incredible. It means you held most people's attention for the majority of the video. This data helps you pinpoint the exact hooks, pacing, and storytelling techniques that keep your audience glued to the screen.
Understanding Your Traffic Sources
Knowing how people found your video is as important as knowing how long they watched it. The Traffic Source Types section breaks down where your views came from, giving you a roadmap of your video's journey across the platform.
Each source tells you something different about your content’s appeal.
Analyzing your traffic sources helps you understand if your content successfully reaches new audiences through the algorithm or if its strength lies within your existing community.
Once you know where your views are coming from, you can start making smarter decisions. Seeing a lot of traffic from the "For You" page? Your hook is working. Not seeing much? It might be time to rework those first three seconds. Some creators also give their content a nudge with paid ads. If you are curious about that, you can learn more about effective strategies in our guide to TikTok advertising.
Identifying and Replicating Success
The Content tab makes it easy to see what hits the mark. It automatically highlights your top nine trending videos from the past week, giving you an at-a-glance look at what resonates with viewers. By studying these top performers, you can start to connect the dots.
Ask yourself a few simple questions about these winning videos:
- What was the format? (e.g., a tutorial, a funny skit, a trending dance)
- What was the topic?
- What sounds or music did I use?
- What did I do in the first three seconds to grab attention?
Answering these questions helps you build a solid theory about what your audience wants to see. From there, you can test that theory by creating new videos that use those same successful ingredients. This data-driven approach removes the guesswork from content creation, putting you on a clear path to making videos that consistently perform. This is what it means to work smarter, not harder.
Getting to Know Your Audience in the Followers Tab
The Content and Overview tabs are great for tracking what is working, but the Followers tab is all about who you connect with. This is where you get to meet the community you are building, one data point at a time. Think of it as your audience's profile page.
Understanding your followers is the secret to making content that hits home. This dashboard gives you a clear picture of who they are and where they are from, helping you answer a crucial question: are you reaching the people you thought you were? The answer, whether it is "yes" or "not quite," is pure gold for your content strategy.

Let's break down how to use this information to build a stronger, more engaged community.
Analyzing Your Follower Growth
Right at the top, you will see the Follower growth chart. It is a simple line graph showing your follower count over the last 7, 28, or 60 days. Its real value lies in showing you the exact moments you gained or lost followers.
This chart becomes insightful when you line it up with your posting schedule. See that big jump in followers last Thursday? Go check what you posted that day. That video did not get views; it convinced people to hit the "follow" button.
A spike in followers is a direct signal from your audience. It tells you, "We want more of this." Your job is to figure out what "this" is—the topic, the sound, the editing style—and replicate it.
By matching growth spurts to specific videos, you can start to build a library of content ideas that are proven to convert viewers into followers.
Using Demographic Data to Sharpen Your Content
Scroll down a bit, and you will find the demographic details. This is where you can confirm if your content is landing with the right audience.
The key metrics here are:
- Gender: A simple percentage breakdown of your followers. Is your content resonating more with one group than another? This helps you tailor your tone and topics.
- Top Territories: This shows you the top five countries your followers call home. This is vital for making your content feel relevant across different cultures.
For instance, you might be a creator in Canada who finds that 30% of your audience is in Australia. That is a big deal. You could start posting at times that work for their time zone or incorporate a few inside jokes that your Aussie followers will appreciate.
Do not underestimate TikTok's global reach. As of early 2025, ads on the app could reach an estimated 28.6% of the world's internet users. With an adoption rate of 34.3% among adults (excluding China), knowing your top territories helps you connect with this massive global audience. You can look deeper into these powerful TikTok statistics to grasp the platform's worldwide influence.
Finding the Perfect Time to Post with Follower Activity
This might be the most practical tool in the entire Followers tab: the Follower activity chart. It is a straightforward bar chart showing the days and hours your audience is most active on TikTok. It is your roadmap to maximum reach.
A video's first few hours on TikTok are make-or-break. The algorithm is watching closely, measuring every like, comment, and share to decide if it is worth pushing to more people. Posting when your followers are already scrolling gives your content the best shot at catching that initial wave of engagement.
It is like timing the launch of a new product. You would want to do it when the most people are out, not at 3 AM. This chart shows you exactly when "rush hour" is for your audience.
Remember, the times are shown in UTC, so you will need to do a quick conversion to your local time zone. Once you have done that, you can pinpoint the one- or two-hour windows where your audience is most likely to see and engage with your new video.
Applying Follower Activity Data
Here is a simple framework for turning the Follower Activity chart into a key part of your posting strategy.
By consistently posting during your peak and shoulder hours, you give every single video the best possible chance to succeed. It is a small adjustment that makes a huge difference in your reach and growth.
Building a Data-Informed Content Strategy
Having all this TikTok data at your fingertips is great, but what matters is turning those numbers into a smarter content plan. This is where you stop guessing and start building a creative strategy based on what you know works.
Think of it this way: your Overview, Content, and Followers tabs are all telling different parts of the same story. A sudden jump in your follower count probably did not happen by accident; it is likely tied to a specific video that took off. And why did that video work? Because it hit the mark with your core audience. It is all connected.
Conduct a Quick Content Audit
First things first, let's figure out what resonates and what falls flat. Head to your Content tab and pull up your videos from the last month or so. It is tempting to look at view counts, but we need to go deeper to find what signals a connection.
- Your Biggest Hits: Find the videos with a high average watch time, lots of shares, and a busy comment section. These are the ones that stopped the scroll and got people talking.
- Your Misses: Now, find the videos with a rock-bottom average watch time and barely any interaction. These are the ones people swiped away from almost immediately.
Put these two groups side-by-side. What patterns do you see? Look at the topics, the formats, the sounds you used, and how you opened the video. The difference between the winners and the losers is your roadmap for what to create next.
Make Content for Your Audience, Not An Audience
The Followers tab is your cheat sheet for understanding who you are talking to. Knowing their age, gender, and where they live should directly influence your creative choices. If your audience is mostly Gen Z, your humor and cultural references should match. If a huge chunk of your followers are from a specific country, think about what is relevant to them.
A data-informed strategy means you stop creating content for a generic, imaginary audience and start making it for the real people who follow you. That shift is how you build a real community, not a follower count.
This is a fundamental part of making any digital campaign work. To see how this idea fits into the bigger picture, check out our guide on building a successful content marketing plan. Knowing your audience is everything.
Test and Validate New Ideas Without the Guesswork
Your analytics are your secret weapon for trying new things without taking huge risks. Instead of blindly launching a new video series, you can test the waters with a few posts and let the numbers tell you if it is a good idea.
Here is a simple way to do it. Over one week, try posting three different video styles.
For example:
- Monday: Post a quick, helpful tutorial.
- Wednesday: Share a raw, behind-the-scenes look at your work.
- Friday: Jump on a trending sound and give it your own spin.
Give it a week, then check the analytics for those three videos. Which one had the best average watch time? Which one got the most shares? The data will point to a clear winner, giving you the green light to make more of that style while ditching the ideas that did not land. This simple cycle of testing, measuring, and adjusting is how you achieve real, sustainable growth on TikTok.
Got Questions About TikTok Analytics? We've Got Answers.
Once you start digging into your TikTok analytics, you will run into a few practical questions. It is one thing to know what the metrics mean, and another to know what to do with them. Let's tackle some of the most common questions that pop up for creators.
How Often Should I Be Checking My Analytics?
Think of it like this: a weekly check-in is your tactical meeting, and a monthly review is your strategy session.
You will want to pop into your analytics at least once a week. This gives you enough data to see how your latest videos perform without getting bogged down by tiny, day-to-day changes. It is the perfect cadence to spot trends and tweak your content plan on the fly.
Then, once a month, set aside time for a deeper dive. This is where you zoom out to see the bigger picture like your overall follower growth, engagement patterns, and which content pillars drive results over the long haul.
Help! Why Did My TikTok Views Suddenly Tank?
It happens to everyone, so do not panic. A sudden drop in views usually boils down to a few common culprits: a shift in the algorithm, a change in what your audience is vibing with, or maybe your last few videos did not hit the mark. The good news is, your analytics will tell you where things went wrong.
Go straight to the metrics for your most recent posts. The two most important clues are average watch time and the video retention graph. If you see a massive drop-off in the first 3 seconds, you know your hook was not strong enough to stop the scroll. Compare the underperforming video’s topic, format, and even the audio to your greatest hits. The difference will usually jump right out at you.
A sudden dip in views is not a failure; it is feedback. It is a chance to learn what your audience does not want, which is as valuable as knowing what they love.
What's a Good Average Watch Time on TikTok?
This is a trick question, because there is no single magic number. A "good" average watch time is relative to how long your video is. Instead of chasing a specific number, focus on the watch-through rate.
As a rule of thumb, getting a solid chunk of your audience to watch past the 50% mark is a fantastic signal to the TikTok algorithm. For short videos (under 15 seconds), you should be aiming for a high completion rate. For longer content (over a minute), your goal is to keep that average watch time climbing by holding viewer attention from start to finish.
At Adworkly, we turn raw data into a roadmap for growth. By blending expert insights with smart AI, we help you look past the numbers and build a connection with your audience. Find out how we can help you grow.