A Guide to TikTok Creator Analytics
Turn views into growth with TikTok creator analytics. This guide shows you how to read key metrics and optimize your content strategy for real results.
TikTok creator analytics is your personal command center. The dashboard shows you how your videos perform, who watches them, and what content connects. To get this access, you need to switch your personal account to either a Creator or Business profile. This is a simple, free switch and the most critical step for your growth.
Why You Need TikTok Creator Analytics
Growing on TikTok without analytics is like driving cross-country without a map. You might get somewhere, but you are mostly guessing. Your analytics are the map. They give you concrete data, so you can stop guessing what your audience wants and start making content you know they will love.
This data tells you which videos succeed, who your core audience is, and when they are most likely scrolling through their For You Page. This is the difference between creating content in the dark and strategically building a community.
From Guesswork to a Growth Strategy
Once you switch to a Creator or Business account, you get access to performance metrics. These numbers are your tool for refining your content strategy.
For example, you notice a video using a specific trending sound gets a spike in views. This is your cue to use similar audio. Or you see your followers are most active around 8 PM on Thursdays. Now you know the perfect time to post for maximum impact.
This data-first approach gives you an advantage:
- Understand Your Audience: You get a clear picture of your followers' demographics. Are they mostly in a specific country? What is the gender split? This helps you create content that speaks to them.
- Identify Winning Content: Easily spot the videos that get the most views, likes, and shares. This is a blueprint showing you what to create more of.
- Optimize Posting Times: Analytics pinpoint the exact hours and days your followers are online, so your new videos land in front of the most people possible.
The scale of the platform makes this data valuable. As of early 2025, TikTok hit 1.59 billion monthly active users. The average person spends about 58 minutes a day on the app. Tapping into a fraction of that audience is huge, and your analytics are the key to doing it effectively. If you want to go deeper, you can learn more about TikTok’s user base and what it means for creators.
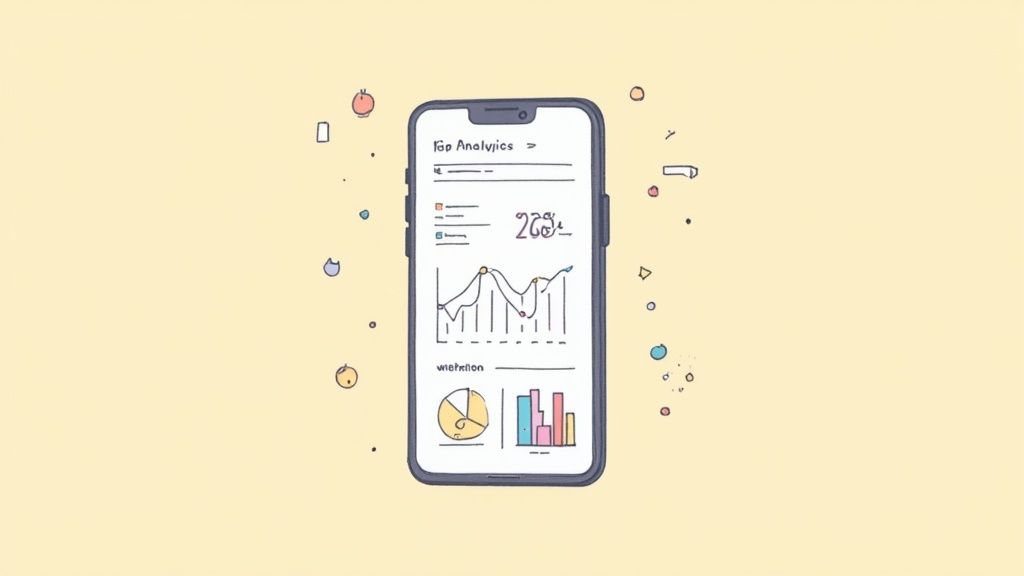
Finding Your Way Around the Analytics Dashboard
Jumping into your TikTok analytics for the first time feels like stepping into the cockpit of an airplane. You have dials, graphs, and numbers everywhere. It is simpler than it looks. Everything is sorted into three main tabs: Overview, Content, and Followers.
Think of these tabs as different lenses for viewing your account's performance. Each one tells a part of your story, helping you figure out what is working, what is not, and who is watching.

This is home base. From here, you can flip between the main tabs to get the full picture of your account's health and your audience's behavior.
The Overview Tab: Your Account’s Health Check
First is the Overview tab. This is your 30,000-foot view, giving you a quick summary of how things are going. You can toggle the date range to see your performance over the last 7, 28, or 60 days. This is perfect for spotting recent trends and long-term growth.
Here you will find the big-hitter metrics in one place:
- Video Views: The raw number of views on your content within the selected timeframe.
- Profile Views: How many people clicked over to your profile.
- Follower Count: A simple line graph showing your follower growth over time. Is it a steep climb or a gentle slope?
This tab is your morning coffee check-in. It gives you a quick, reliable pulse on whether your account is growing, stagnating, or taking a dip.
Your dashboard is a direct reflection of your content's resonance. A sudden spike in video views on a specific day in the Overview tab tells you that something you posted performed exceptionally well. This prompts a deeper look into the Content tab.
The Content Tab: Video-by-Video Analysis
If the Overview tab is the big picture, the Content tab is where you use the magnifying glass. This section lets you drill down into the performance of individual videos posted in the last seven days. It is the key to understanding why certain videos pop off while others fall flat.
Here, you get the details for each video: views, likes, comments, and shares. You also see the average watch time and your top traffic sources. Did a video get popular on the For You Page or did it get most of its views from your existing followers? The answer is here. For an even deeper analysis, you can explore a dedicated TikTok analytics tool to get more granular data.
The Followers Tab: Get to Know Your Audience
Finally, we have the Followers tab. This is the most important section because it is about the people on the other side of the screen. Creating content that resonates means knowing exactly who you are creating it for.
This tab breaks down your audience demographics, so you can stop guessing and start knowing.
- Gender: A simple percentage split of your audience.
- Top Territories: See which countries your fans are watching from. This is huge for localization and cultural relevance.
- Follower Activity: A useful chart showing the exact hours and days your audience is most active on the app.
This data is pure gold. With this knowledge, you can tailor your content to your audience's tastes. You can also post when they are most likely to see it. Posting during those peak activity hours gives your content the best possible launchpad for success.
Making Sense of Your Key Performance Metrics
Your TikTok analytics dashboard is packed with numbers, but what do they mean? To grow your account, you need to look past the surface and understand the story your data tells. These key performance metrics are the building blocks. When you put them together, they reveal the true picture of your content's performance.
Each metric is a piece of a puzzle. A single piece, like video views, shows you how many people saw your content. It does not tell you if they liked it. The full image starts to take shape only when you add the other pieces: likes, comments, shares, watch time.
Core Engagement Metrics
Engagement is your audience talking back to you. When people like, comment on, or share your videos, they give you direct feedback. These actions are signs that your content struck a chord, whether it was funny, informative, or relatable.
A flood of likes is a quick thumbs-up. Comments show a deeper level of investment because someone took the time to type their thoughts. Shares are the gold standard. When someone shares your video, they are personally vouching for it and putting it in front of their own friends and followers.
This data gives you a snapshot of your follower demographics, which is a crucial part of your overall analytics. Knowing the age and gender of your audience is key to creating content that genuinely connects with them.
Before we discuss watch time and traffic sources, let's break down the most fundamental metrics every creator needs to know.
Core TikTok Performance Metrics Explained
This table unpacks the core performance metrics you will find in your dashboard. Understanding what each one measures and why it matters is the first step toward building a data-driven content strategy.
By keeping an eye on these numbers, you get a clearer picture of what is working and what is not. This allows you to fine-tune your approach for better results.
Watch Time and Retention Metrics
Immediate engagement is great, but how long people watch your videos is a massive factor for the TikTok algorithm. Watch time metrics are about attention. How good are you at grabbing it and holding it?
The two big players here are total watch time and average watch time.
- Total Watch Time: This is the combined minutes and hours everyone has spent watching your video. A huge total watch time tells the algorithm your video is great at keeping people on the platform. This is what TikTok wants.
- Average Watch Time: This tells you how long a typical viewer watched your video. If your video is 60 seconds long and your average watch time is 45 seconds, you have created something compelling.
A short average watch time is a red flag. It might mean your opening hook was not strong enough. It could also mean the video did not live up to the promise you made in the first few seconds.
Your average watch time is a goldmine of information. If it is nearly the full length of your video, you have hit a home run. That is a strong signal from your audience to make more content just like it.
Traffic and Audience Source Metrics
Knowing how people find your videos is as important as knowing how many people watch them. Your analytics dashboard breaks down your traffic sources, giving you a map of your viewers' journey to your content.
Here are the most common traffic sources you will see:
- For You Page: This is TikTok’s main discovery feed. When a high percentage of your views come from the FYP, the algorithm is pushing your content to a wide, new audience.
- Following Feed: These views come from people who already follow you. This metric shows how well you are engaging your existing community.
- Profile: This is when someone visits your profile page and then clicks on a video to watch. It often indicates a high-intent viewer.
- Search: These are views from people who found your content by typing keywords into the search bar. This is great for understanding what topics people associate with your account.
Analyzing these sources tells you whether you are growing by reaching new people or by nurturing your loyal fanbase. For e-commerce brands, pairing this data with sales figures reveals insights. We cover this in more detail in our guide to TikTok Shop analytics. By understanding your traffic sources, you can build a smarter strategy to maximize both reach and engagement.
Getting to Know Your Audience With Follower Insights
If you want your content to land, you have to know who you are talking to. The Followers tab in your TikTok analytics is where you stop guessing and start getting real answers. It is your window into the community you are building, swapping assumptions for hard data about who they are and how they behave.
Here you get a clear snapshot of your community's makeup. You will see your total follower count. You will also see a chart tracking your growth over the last seven or 28 days. This little graph is gold. It helps you pinpoint which videos are bringing new people in and which ones are missing the mark.
Who Are Your Followers?
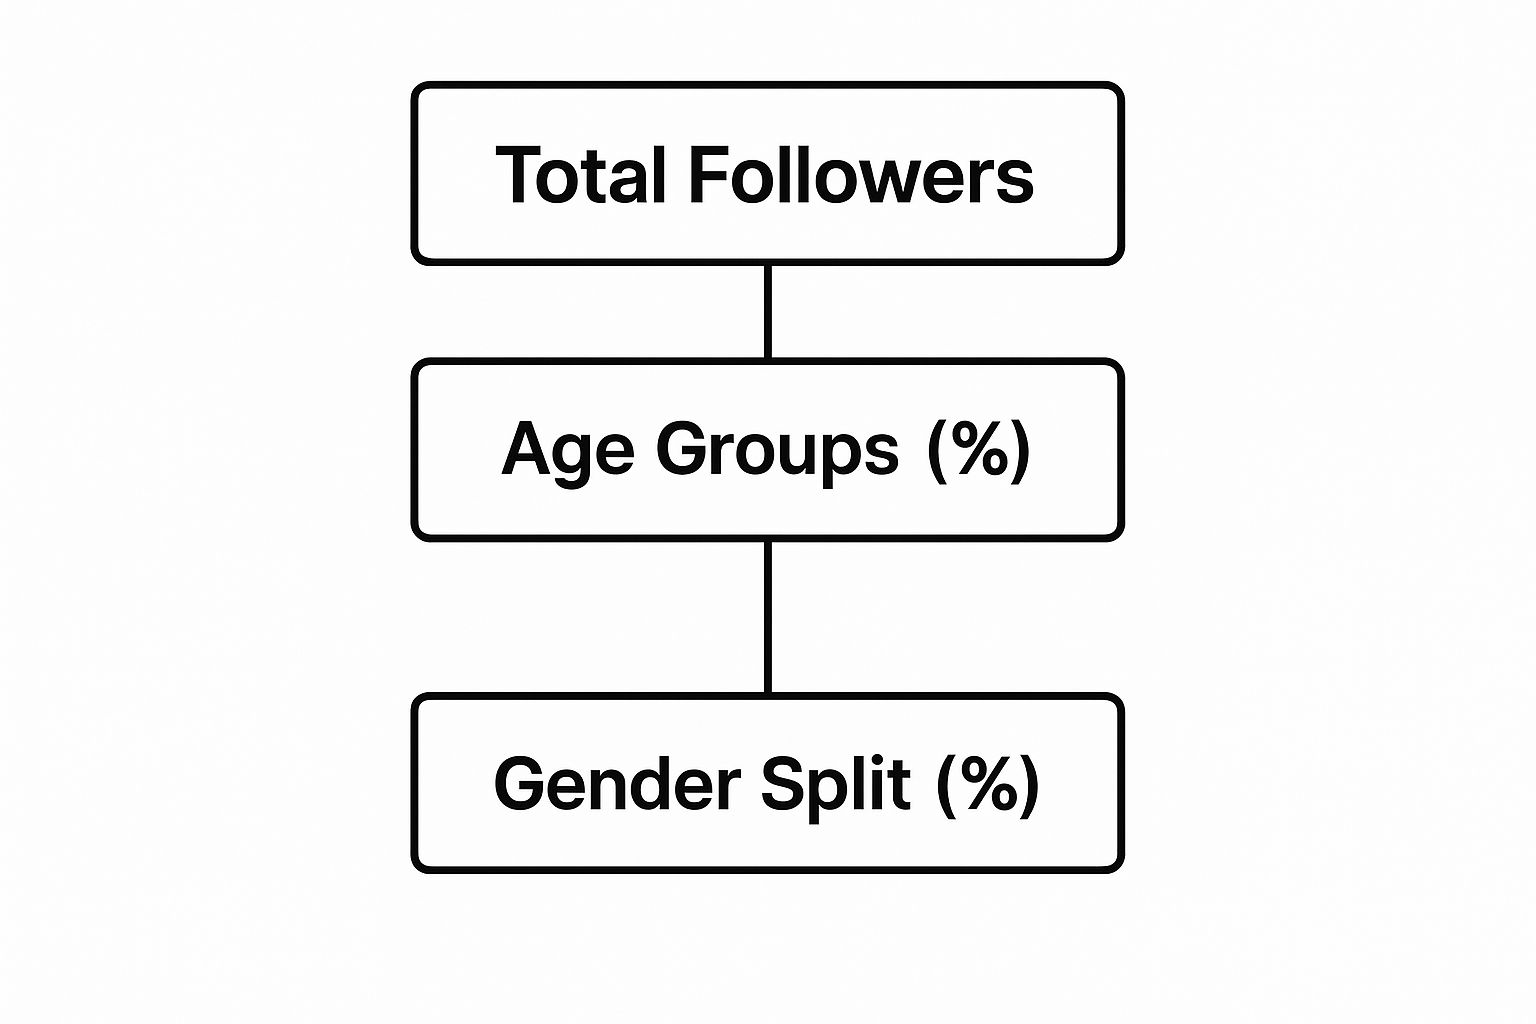
Beyond the numbers, this tab tells you who is on the other side of the screen. TikTok gives you a demographic breakdown that is perfect for building a detailed persona of your ideal viewer. This is the key to making sure your content’s tone, topics, and style resonate with the people watching.
Here is the specific info you will find:
- Gender Distribution: A simple percentage split between your male and female followers. Are you talking to a mixed crowd or one that skews heavily in one direction?
- Age Ranges: This shows you which age brackets dominate your audience, like 18-24 or 25-34.
- Top Territories: Find out the top countries your followers are watching from. You might be surprised to find a big audience in a place you never expected. This opens new opportunities to create content for them.
With this data, you can create content that feels like it was made for them. An audience of mostly 18-24 year-olds in the United States will have a different sense of humor and jump on different trends than an audience of 35-44 year-olds in the United Kingdom.
Nailing Your Post Timing for Maximum Reach
The most practical, ready-to-use insight in the Followers tab is the Follower Activity chart. This tool is a huge help. It shows you the exact hours and days your followers are most active on TikTok. This completely eliminates the guesswork from your posting schedule.
Posting when your audience is already scrolling gives your content the best possible head start. Your video shows up when they are looking for something new, dramatically increasing the chance of that initial burst of engagement.
The chart is usually a heatmap. Darker colors show you the peak activity times. For example, you might see your audience is consistently online between 6 PM and 9 PM on weekdays.
By lining up your posting schedule with these peak hours, you are giving every video a strategic advantage. It is a small tweak that can lead to a huge bump in initial views, likes, and comments. That early engagement is a signal to the TikTok algorithm that your content is a hit. This can help launch it onto the For You Page for even more people to see.
Turning Analytics into a Better Content Strategy
Data is a bunch of numbers until you use it to make smarter decisions. Think of your TikTok analytics as a roadmap for creating content that genuinely connects. By figuring out what your audience loves, you can stop throwing ideas at the wall and start building a strategy that works.
The best place to start is with your winners. Go to the Content tab in your analytics and find the videos with the highest views, shares, and average watch time. These are not your greatest hits. They are your blueprints for success.
Once you have your top-performing videos lined up, play detective and figure out why they worked so well. This creates a feedback loop where hard data shapes your creative instincts.
Identify and Replicate Winning Formulas
Your most popular videos are packed with clues. Look for the common threads that tie them together. You will start to see a formula emerge that you can test in your future content. Do not focus on the topic. Get granular and look at the structure and style.
Ask yourself these questions about your best videos:
- The Hook: What did you do in the first three seconds? Was it a bold statement? A fast visual cut? A question that made people stop scrolling?
- Audio Choice: Did you use a trending sound that was all over the For You Page, or did you create original audio? The right sound can pull in a whole community.
- Video Format: Was it a step-by-step tutorial, a funny skit, a raw behind-the-scenes moment, or a listicle video? The format sets the expectation.
- Pacing and Edits: How quickly did you cut from one shot to the next? Fast-paced, dynamic edits are often the key to keeping eyes glued to the screen.
When you isolate these key ingredients, you can start mixing them into new video ideas. This gives your next post a much better shot at hitting the mark.
Learn from Underperforming Content
Your flops are as valuable as your viral hits. They teach you what your audience does not want. It is time to give these videos the same critical look you gave your top performers.
Look for patterns here, too. Do videos about a certain subject always fall flat? Is there a specific format that consistently gets a low average watch time? This is your audience telling you what to avoid.
If you see a video’s watch time take a nosedive after a few seconds, that is a clear sign your hook did not work. This is not a failure. It is a specific, actionable piece of feedback telling you to nail the intro next time.
This data-first approach is fundamental to making an impact online. For brands, combining these on-platform insights with a bigger-picture strategy separates good from great. You can find out more about building a comprehensive plan in our guide to influencer marketing.
The TikTok creator world is crowded. As of 2025, there are about 1.5 million active creators on the platform globally. Superstars like Khabane Lame have amassed over 162 million followers. A single video can get billions of views. To stand out, you have to constantly refine your approach using your own data. For more numbers, check out these stats about the creator economy on Exploding Topics.
Common Questions About TikTok Analytics
Going into your TikTok analytics for the first time can feel like you have been handed a complex puzzle. You have all this data, but what does it mean? It is normal to have questions. Getting them answered is the first step toward using this information to grow your account.
Let's clear up some of the most common questions people have.
https://www.youtube.com/embed/JMyRpoAOcAQ
One of the first things you will wonder is whether you can trust these numbers. The short answer is yes, your TikTok analytics are generally accurate. But there is a small catch: all the data is recorded in Coordinated Universal Time (UTC). So, if you are in New York and see a huge view spike at 3:00 AM, it is not because your local audience is full of night owls. It means viewers in a different time zone, maybe in Europe or Asia, were loving your content.
Why Can't I See My Analytics?
Did you flip the switch to a Creator or Business account and now you are staring at a blank analytics page? Do not panic. This is completely normal.
TikTok needs time to start gathering data for you. You need to post at least one public video after you have made the switch for the analytics engine to kick in. It usually takes about seven days for your first full set of data to show up. After that initial week, everything should update regularly. So, a little patience goes a long way.
What if your analytics were working fine and suddenly stopped? Before you panic, try these quick troubleshooting steps that usually work:
- Restart the App: It sounds simple, but closing and reopening the app often fixes a temporary glitch.
- Check for Updates: An outdated app can cause strange issues. Go to your app store and make sure you are running the latest version of TikTok.
- Clear Your Cache: Your app builds up old data over time. Go into your 'Settings and Privacy,' find the 'Clear Cache' option, and tap it. This will not delete your drafts or anything important, but it can solve performance problems.
What's Going On With These Sudden Spikes and Dips?
Watching your views suddenly shoot up or fall off a cliff can be a rollercoaster. These dramatic shifts are almost always tied to how your content performs on the For You Page (FYP). A sudden spike is great news. It means the algorithm picked up one of your videos and is pushing it to a bigger audience.
A sudden drop can happen for a few reasons. Maybe you posted a video that did not click with your audience, or you posted when your followers were offline. The key is not to overreact to the performance of a single video.
Look for trends over time instead of fixating on one-day fluctuations. Consistent analysis of your top-performing videos will give you a clearer picture of what works for your audience than reacting to a single dip in views.
When Will I See My Follower Demographics?
The Followers tab is where you learn who is watching your content. You will not see anything there right away. TikTok requires you to have at least 100 followers before it shows detailed demographics like gender, age, and location.
This is not an arbitrary number. It is to make sure there is enough data to give you meaningful insights while keeping user information anonymous. Once you hit that 100-follower milestone, that tab will light up with all the audience info you need to start making content that truly connects.
Ready to turn your analytics into viral growth? Adworkly combines expert strategy with AI to help your app succeed. Learn how we can optimize your campaigns and drive results.