TikTok Shop Analytics: A Guide to More Sales
Use this guide to TikTok Shop analytics to understand customers, track performance, and make data-driven decisions that grow your revenue.
TikTok Shop analytics is your store's performance dashboard. It takes all the activity, including clicks, views, adds-to-cart, and purchases, and translates it into data. The tool shows you what content makes you money, which products sell well, and how your customers behave. This process is not about guessing; it is about making informed decisions for your business.
What Is TikTok Shop Analytics
TikTok Shop analytics is the built-in reporting tool inside your TikTok Seller Center. It gives you a complete picture of your store's health, tracking everything from when a customer first sees your product to the final sale. Using this tool is necessary if you want to succeed on the platform.
Running a TikTok Shop without analytics is like trying to navigate a new city without a map. You are driving blind. With analytics, you get a clear roadmap showing which paths lead to sales and which are dead ends. This information allows you to fine-tune your marketing, sharpen your product pages, and increase your revenue.
This visual shows the journey from raw data to revenue, showing how each piece of the analytics puzzle fits together.
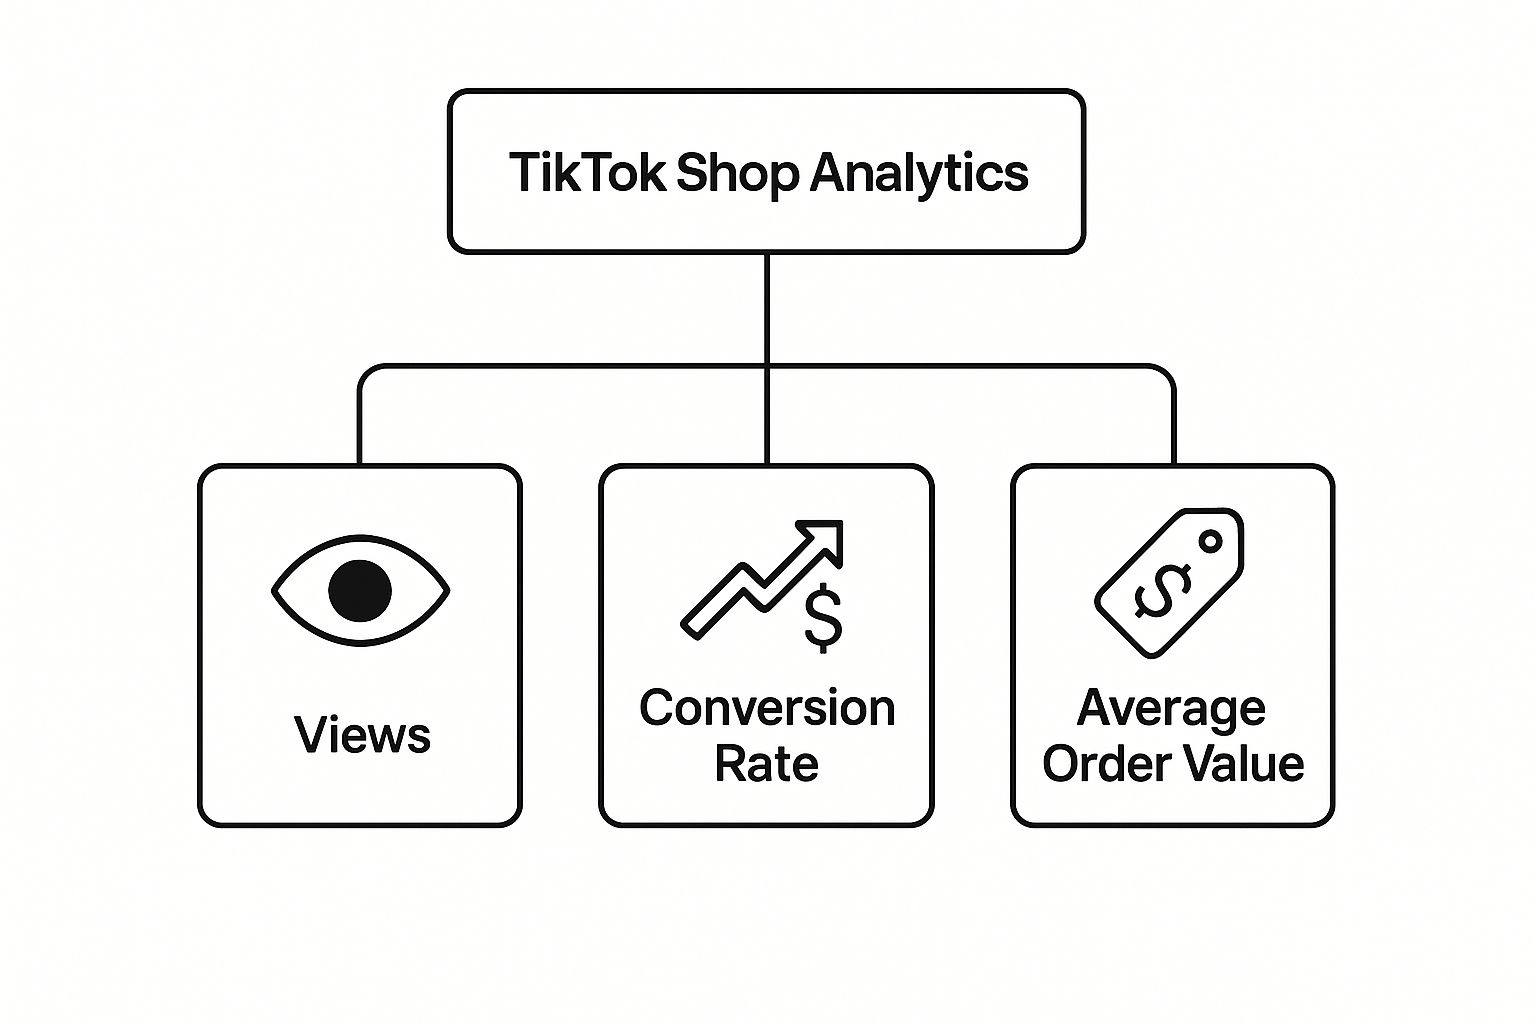
As the graphic shows, the goal is to guide customers smoothly from the initial product view to a completed purchase with a healthy order value.
Why Your Data Matters
The data you see connects to TikTok's large user base. As of early 2025, the platform has over 1.6 billion active users worldwide. This volume of activity creates an opportunity for e-commerce, where fast-paced, video-first discovery fuels impulse purchases. You can explore more about TikTok's user statistics and what they mean for sellers.
By studying your analytics, you learn how to speak your audience's language. You see what makes them interested and, more importantly, what makes them click "buy."
Your analytics dashboard is more than a set of numbers. It tells a story about your customers, your products, and your content. Learning to read that story is how you grow your shop.
To better understand the types of stories your data can tell, it helps to break the metrics down into a few key categories.
Key Metric Categories in TikTok Shop Analytics
This table summarizes the main data types in your dashboard and the questions each category helps you answer.
Each of these categories provides a different lens to view your business, giving you the complete picture you need to make strategic moves.
The Foundation of Your Strategy
This data is the bedrock of a solid sales strategy. Instead of chasing trends or copying what other sellers do, you can build a plan based on the proven behavior of your audience. The benefits are immediate and tangible:
- Identifying Top Products: Instantly spot which items generate the most buzz and sales, which is important for smart inventory management.
- Understanding Customer Behavior: Trace the entire customer journey to pinpoint where shoppers drop off and what convinces them to make a purchase.
- Optimizing Content: Figure out which videos convert viewers into customers, so you can stop wasting time and focus on what works.
Your analytics dashboard is the command center for your entire e-commerce operation on TikTok. By checking it regularly and acting on the insights you find, you create a sustainable growth engine for your business.
Where to Find Your Analytics Dashboard
Before you start looking at the numbers, you first must know where to find them. Everything you need is inside the TikTok Seller Center. Think of it as your shop's mission control for products, orders, promotions, and performance data.
Getting there is simple. The first step is logging into your account.
You will start at the main login page for the TikTok Seller Center.
This is your front door to every tool you have to manage your shop, including the analytics dashboard.
Once you are in, look at the navigation menu on the left side of the screen. You are looking for the "Analytics" tab. Click it, and you are in. This is your main data hub, where the work of understanding your shop's performance begins.
Navigating the Main Dashboard
The analytics dashboard is organized into a few key areas, so you can quickly get a high-level view or examine something specific. Getting a feel for these main tabs is the first step toward mastering the tool.
You will see four primary tabs:
- Shop: This is your 10,000-foot view. It gives you an overview of your entire store’s performance with metrics like total revenue, number of orders, and your overall conversion rate.
- Product: Want to know what is selling fast? This is the place. Here, you can analyze individual items to see which products get the most views, adds-to-cart, and sales.
- Content: This tab connects your creative efforts to your sales data. It connects your TikTok videos and livestreams to shop activity, showing you which posts drive traffic and make you money.
- Creator: If you work with affiliates, this tab is your command center for tracking their impact. You can see the sales, commissions, and clicks generated by each creator you partner with.
This layout lets you zoom in and out. You can start with a broad look at your shop’s health and then, with a few clicks, perform a detailed analysis of how a single video impacted sales last Tuesday.
Think of the main dashboard as the table of contents for your business's story. Each tab is a different chapter, telling you everything from your overall sales narrative to the side-plot of a single creator's performance.
How to Filter and Adjust Your Data View
The dashboard is interactive. You can slice and dice the data to answer specific questions about your business, which is how you find important insights.
The most useful tool is the date range filter. You can adjust this to see data for the last 7 days, 30 days, or a custom range to analyze how a specific promotion performed. This is perfect for spotting short-term trends or comparing performance month over month.
You can also apply filters within each tab. For instance, in the 'Product' tab, you can isolate a single product to see its unique performance metrics. This is the kind of detailed information that helps you make smart decisions, like whether to restock an item or rethink its marketing. Getting comfortable with these filters separates a casual glance from an effective analysis.
Making Sense of Your Key Traffic and Conversion Metrics
When you first open your TikTok Shop analytics dashboard, it is easy to get lost in numbers. But here’s the secret: not all metrics are equal. To get a handle on your shop's health, you need to focus on two big categories: traffic and conversions.
Think of it this way: traffic metrics tell you how many people walk into your store, while conversion metrics tell you how many buy something.
You can have all the traffic in the world, but if no one is buying, you do not have a business. A great conversion rate does not mean much if only a few people visit your shop. A successful shop finds the sweet spot between both.
Core Traffic Metrics: Who's Stopping By?
Traffic is the top of your funnel. It is about getting eyeballs on your products. These metrics measure how well your content reels in potential customers and gets them to your product pages.
Here are the essential traffic numbers to watch:
- Product Views: This is the total number of times your product pages were seen. A high number here is a great sign that your videos or LIVEs are sparking curiosity.
- Visitors: This is the number of unique people who visited your shop or product pages. It gives you a clear picture of your audience size over a period.
- Traffic Sources: This is where the gold is. It shows you exactly where your visitors came from: your profile page, a specific video, a LIVE stream, and so on.
Understanding your traffic sources is critical. If you find one video drives 80% of your product views, that is a massive clue. It tells you that style of content is resonating, and you should make more like it.
Essential Conversion Metrics: Who's Buying?
Once you have traffic, the next step is turning those lookers into buyers. Conversion metrics track how effective you are at closing the deal. They tell you if your product pages, pricing, and offers are hitting the mark.
Your conversion rate is the bridge between attention and revenue. High traffic is great, but without conversions, it's noise. A low conversion rate often points to a problem on your product page.
These are the main conversion metrics you need to know:
- Gross Merchandise Value (GMV): The big one. This is the total value of everything sold through your shop before any fees or expenses are taken out. It is the clearest indicator of your total sales volume.
- Revenue: This is the money that lands in your pocket after accounting for refunds and returns.
- Conversion Rate: The classic. This is the percentage of visitors who make a purchase. You calculate it by dividing your total orders by your total visitors.
- Average Order Value (AOV): This shows you, on average, how much a customer spends each time they buy from you. A rising AOV is fantastic because it means customers are buying more or higher-priced items.
Seeing a ton of Product Views but a tiny Conversion Rate? That is a classic red flag. It means people are interested enough to click, but something is stopping them from buying. It could be anything from your price and shipping costs to your product description or photos.
Connecting Traffic to Sales: The Full Story
The real magic happens when you start looking at your traffic and conversion metrics together. That is when the data starts to tell a story about your customer’s journey, from the moment they see your video to when they hit "buy now."
And the opportunity is huge. In the United States alone, TikTok Shop hit $9 billion in gross merchandise value in its first year, with over 398,000 active stores. This is not a trend; it is a massive, engaged audience ready to shop. You can find more details on TikTok's explosive e-commerce growth on amraandelma.com.
Your job is to tap into that audience, guide them from a video to your product page, and give them every reason to make a purchase.
Analyzing the Customer Journey in Action
Let's walk through a real-world example. Say you post a video showing off a new gadget. You check your analytics and see:
- Traffic Source Data: The video sent 10,000 visitors to your product page.
- Conversion Data: Out of those visitors, 200 people bought the gadget.
- Calculate Conversion Rate: Your conversion rate from that one video is 2% (200 orders ÷ 10,000 visitors).
Now you have a benchmark. If you post another video that also drives 10,000 visitors but only gets 50 orders (a 0.5% conversion rate), you have concrete proof that the first video's message or format was more effective. This is how you stop guessing and start making data-driven decisions to refine your content.
This analysis also helps you understand which channels are the most profitable. For more detail, learn how to calculate customer acquisition cost to see where your money is best spent.
Diving Into Your Product Performance
Your overall shop metrics give you a bird's-eye view, but the real gold is hidden in your individual product data. This is where you find out what your customers want, letting you pinpoint your champions and shelf-warmers. Looking into this data is how you will make smarter decisions on everything from stocking inventory to your next video.
Your command center for all this is the Product Analytics tab right inside your Seller Center. Think of it as moving from a wide-angle lens on your shop to a microscope on each item. It shows you which products are getting the views, the clicks, and the sales.
Finding Your Winners and Weeding Out the Duds
First, you need to sort your products into two buckets: the stuff that sells fast and the stuff that does not. The Product Analytics dashboard makes this easy.
Go in and sort your product list by Total Sales or Units Sold. The products that appear at the top are your stars. They are the proven winners your audience loves, and they are likely the backbone of your revenue.
Now, flip that sort. The items at the bottom are your underperformers. They take up digital real estate in your shop but do not pull their weight. In a few clicks, you get a clear ranking of your entire catalog.
The Product Metrics That Matter
Beyond sales, a few key metrics paint a much richer picture of how customers interact with each product. Following these numbers helps you trace the customer's journey from a casual view to a final purchase.
- Product Page Views: How many eyeballs landed on a specific product's page? This tells you how much interest your videos or promotions are drumming up for that item.
- Add to Cart Frequency: Of the people who viewed the page, how many took the next step and added it to their cart? A high rate here signals strong buying intent.
- Purchase Ratio (Conversion Rate): This is the final test. What percentage of page views turned into a sale? This number tells you how effective your product page is at closing the deal.
Let's say one of your products got 10,000 views and 500 adds to cart. That is a 5% add-to-cart rate. If 100 of those views resulted in a purchase, its conversion rate is 1%. You need to track these numbers for every single item.
A product that gets tons of views but almost no sales is waving a giant red flag. People are interested enough to click, but something on the product page itself, like the price, the description, or the photos, is stopping them.
This is a classic disconnect. Your TikTok content did its job and got them curious, but the product page fumbled the handoff. That is your cue to start optimizing.
From Insights to Actionable Strategy
Data is data until you do something with it. Your analysis needs to spark real changes that improve your shop's bottom line.
For your top-performing products, the game plan is straightforward. Double down. Keep them in stock, feature them in more content, and make them the heroes of your shop. You already know people love them, so give them more of what they want.
With the underperformers, you have a decision to make. You can try to revive them or pull the plug. To give them a chance, try revamping the product page with better photos, a more compelling description, or a price adjustment to see if that moves the needle.
Sometimes, a product is not the right fit. If your tweaks do not work, do not be afraid to discontinue it. That frees up your time, energy, and marketing budget to focus on the products that make you money. Using your TikTok Shop analytics this way is how you cultivate a lean, profitable, and desirable product catalog.
Connecting Content Analytics to Shop Sales
https://www.youtube.com/embed/iB1my6y1JGU
Think of your TikTok content as the lifeblood of your store. It is not about getting views or likes; it is the engine that pulls customers through your virtual door. The magic happens when you can draw a straight line from a video or a livestream to a sale, and that is what the ‘Content’ tab in your TikTok Shop analytics is for.
This is where your creative efforts meet data. The dashboard shows you which videos make people click on your products, add them to their cart, and check out. By looking at this information, you stop guessing what works and start knowing what a successful, sales-driving video looks like for your brand.
Identifying Your High-Impact Content
First, you need to find the content that is not popular but profitable. Inside your Content Analytics dashboard, you can sort all your videos by important sales metrics like Revenue Generated or Product Clicks. Doing this instantly surfaces the videos that successfully turn viewers into shoppers.
Once you have identified a winner, it is time to be a detective. What made it work so well? Was it a quick, punchy demo that got straight to the point? Or was it a longer, more in-depth tutorial that answered every possible customer question? Pinpointing these successful elements, like the hook, the format, or the call to action, gives you a repeatable formula for future content.
Your best-performing content is a direct conversation with your audience telling you exactly what they want to see. Your job is to listen to that feedback and create more of it.
This data-driven approach takes the guesswork out of content creation. Instead of throwing ideas at the wall and hoping something sticks, you can build a library of videos that you know will connect with your audience and drive sales. For a complete overview of the platform's data tools, check out our guide on TikTok analytics.
Evaluating Different Content Formats
It is important to remember that not all content is created equal or for the same purpose. Some videos are fantastic for grabbing attention and building brand awareness, while others are built to convert. Your analytics will reveal which formats are the heavy hitters for your specific products and audience.
You might find that short videos using a trending sound get a lot of views but do not move the needle on sales. A longer, user-generated content (UGC) style video or a detailed product demonstration might get fewer eyeballs but have a higher conversion rate. This is gold. It tells you where to invest your time and energy, helping you create a balanced content mix that both builds your audience and guides them toward a purchase.
To understand how different types of content typically perform, take a look at this breakdown:
Content Formats and Their Typical Sales Impact
This table is a great starting point, but always let your own data be your guide. What works for one brand might not work for another.
The global market also plays a role. TikTok Shop sales data shows success in Southeast Asia, with Thailand leading at 512.79 million** (**25.84%** of total sales) and the Philippines close behind with **500.51 million (25.22%). Western markets like the United States (45 million**) and the United Kingdom (**42.39 million) are still growing. This tells us buying habits can vary by region, which is something to keep in mind as you refine your content strategy.
Analyzing Livestream Performance
Livestreams are a different kind of sales tool with their own dedicated analytics. While you are live, you can see real-time data on viewer counts, engagement rates (like likes and comments), and sales generated right from the stream.
Once the livestream is over, the real analysis begins. Look at the summary to see which products sold well and when sales peaked. Did sales jump when you showed off a specific feature? Did that limited-time offer you announced create a buying frenzy? Figuring this out helps you sharpen your live selling strategy, making every future event more engaging and profitable.
Using Analytics for Shop Optimization
All this data is great, but it is a set of numbers until you do something with it. Your TikTok Shop analytics dashboard is your roadmap; now it is time to drive. The secret is building a simple, repeatable process of looking at the data, taking action, and seeing what improves.
Most successful sellers I know do not live in their analytics every day. Instead, they find a rhythm that works. A quick weekly check-in is perfect for catching problems or jumping on a hot trend. A more in-depth monthly review helps you see the bigger picture and make smarter, long-term decisions. This approach keeps you on top of things without getting lost in the data.
Turning Insights into Action
Every time you open your analytics, you should try to answer one core question: "What can I do better?"
Let’s say you spot a product with tons of views but a terrible conversion rate. That tells you people are interested, but something stops them from buying once they land on the product page. That is not a statistic; it is a clear signal to take action.
Here are a few real-world examples of how to connect the dots:
- Low Click-Through Rate on Products: If your product appears in videos but nobody taps to see more, your first impression might be off. Try swapping out the main product photo for something more eye-catching or change how you showcase it in your videos.
- High Add-to-Cart, Low Purchase Rate: This is a classic. Shoppers are close, but they leave at the last second. The number one culprit is surprise shipping costs. Test a free shipping promotion and watch what happens to your abandoned cart numbers.
- Low Average Order Value (AOV): People are buying, but they only buy one small thing at a time. This is a huge opportunity. Start bundling related products together or suggest "people also bought" items on your product pages to encourage a bigger spend.
Identifying and Acting on Trends
Beyond the quick fixes, your analytics help you zoom out and see what is happening over time. Reviewing data across several weeks or months is how you shift from putting out fires to strategically building your business. For more detail on all the data points at your disposal, you can explore the various features of a TikTok analytics tool.
Start by looking for patterns, like seasonal sales bumps. If you sell swimwear, you would expect sales to climb in late spring. Seeing that trend in your data lets you stock up on inventory and schedule your content months ahead to ride that wave.
Your data tells a story about what your audience wants and when they want it. Identifying trends over time is like reading the next chapter of that story before it happens, giving you an advantage.
You might also spot a whole product category that is starting to take off. If you notice a few related items are all gaining traction, that is your cue to double down and expand that part of your catalog. This is what a data-driven strategy looks like. You invest in products you already know people want, which cuts down on the risk of ending up with dead stock.
This cycle of look, act, and repeat is how you turn TikTok Shop analytics into a real engine for growth.
Frequently Asked Questions
As you look at your TikTok Shop data, you might have some questions. Here are some quick, straightforward answers to the ones we hear most often, designed to help you get unstuck and feel more confident with your numbers.
How Accurate Is TikTok Shop Analytics Data?
For the most part, you can trust the data you see in your Seller Center. TikTok tracks everything, including views, clicks, and purchases, right on its own platform, so the information comes straight from the source.
You might notice a small lag sometimes. It is common for sales data to take a few minutes to refresh on your dashboard. This is normal, so do not panic. When it comes to making bigger strategic decisions, the data is reliable enough to guide you.
How Often Should I Check My Analytics?
This is a great question, and the key is finding a rhythm that keeps you informed without making you obsessive. You do not want to get bogged down checking your stats every five minutes.
For most sellers, a tiered approach works well:
- Daily Quick Look: Spend five minutes in the morning glancing at your main dashboard. You are looking for major red flags or big wins, not deep analysis.
- Weekly Analysis: Block out 30 minutes once a week. This is your time to look at which products and videos are performing well. Figure out what worked and use those insights to plan your content for the week ahead.
- Monthly Review: Go deeper once a month. Look at the bigger picture: your overall growth, long-term trends, and what it all means for your marketing and inventory strategy.
Remember, checking your analytics is not about watching numbers move. It is about finding the story in your data that helps you make the next smart decision. A consistent routine like this keeps you from feeling overwhelmed.
Can I Track Affiliate Creator Performance?
Yes, and you absolutely should. Your Seller Center has a dedicated Creator tab inside the analytics section for this.
This dashboard breaks down how much value each affiliate brings to your shop. You can see all the important metrics, including:
- Product Clicks: See which creators are driving traffic to your listings.
- GMV (Gross Merchandise Value): Know the total sales revenue generated by each creator's content.
- Commission: Keep track of how much you have paid out to each affiliate partner.
This data is gold for managing your affiliate program. It instantly shows you who your top partners are so you can nurture those relationships. It also helps you spot which creators are not delivering, allowing you to fine-tune your collaboration strategy and invest your resources wisely.
At Adworkly, we merge expert strategy with deep analytics to help brands like yours thrive on TikTok. See how our approach can improve your marketing and deliver real results. Learn more at https://adworkly.co.